Muma Children’s Hospital is committed to providing high-quality care and sharing data about how well we follow guidelines for care. Here you will find information from reports on key quality measures that affect the patient care experience and health outcomes including patient safety indicators, hospital-acquired infections, and patient satisfaction. These measures are updated as new data is collected and becomes available.
Muma Children’s Hospital follows guidelines established by various quality agencies and organizations to identify best practices to ensure our patients are receiving the safest and most innovative care in America.
Leapfrog Safety Grade Rating
It is with great honor to share with you that Muma Children’s Hospital received the highest achievement for Patient Experience (the standard in the CAHPS Child Hospital Survey) in the Leapfrog Hospital Safety Survey by The Leapfrog Group. The Leapfrog Group is a national watchdog organization of employers and other purchasers known as the toughest standard-setters for health care safety and quality. Last year, we met the requirements to report for patient experience with results showing “Limited Achievement”. In less than a year, we have been awarded, “Achieved The Standard” by Leapfrog. To see pediatric results, use the link above and go to the “Pediatric Care” section.
This achievement is a reflection of our deep commitment to the well-being of the children and families at Muma Children’s Hospital, and a tribute to the world-class care provided by our clinical and teams and support partners. We would like to commend you on this well-deserved recognition and accomplishment.
Hospital-Acquired Infections
Hospital-acquired infections are caused by bacteria presumed to be acquired in the hospital. Patients can be infected through catheters required for care, such as intravenous lines. One of the most common types of hospital-acquired infections is Central Line-Associated Bloodstream Infections (CLABSI).
CLABSI
per
1,000
catheter days
10/01/2023 to 9/30/2024
0.8 infections per 1000 catheter days.
Patient Satisfaction
The Child Hospital Consumer Assessment of Healthcare Providers and Systems (Child HCAHPS) is a national survey that asks patients about their experience during a recent hospital stay. Tampa General Hospital performs comparable or above in overall patient satisfaction and likelihood to recommend than most pediatric hospitals in the U.S.
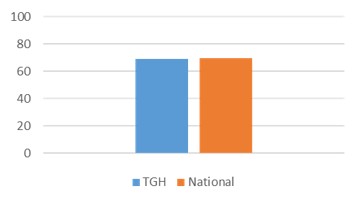
% of patients that rate TGH a 9 or 10 on a 0-10 scale

This chart shows the TGH and National values for the metric 'Percentage of patients that rate the hospital they used a 9 or 10 on a 0-10 scale'
| TGH | 73.02% |
|---|---|
| National | 73.94% |
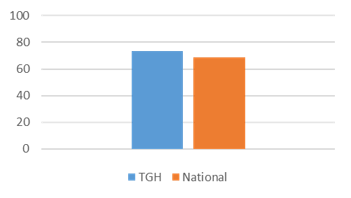
% of patients that would definitely recommend TGH

This chart shows the TGH and National values for the metric 'Percent of patients that would definitely recommend the hospital they used'
| TGH | 81.75% |
|---|---|
| National | 79.30% |
Pediatric Emergency Department Metrics
Left Without Being Seen
<2%
Actual
0.57%
Door to Doctor
23 Minutes
Average
16.6 Minutes
Hand Hygiene
98%
Q1 - 99%
Q2 - 97%
Q3 - 96%
Q4 - 98%
